
Sales slowed a little in June. 129 homes sold, down from 140 in May. That was the first month-over-month drop since February — sales had climbed all spring, from 70 in February to 104, 108, then 140. June still came in a touch ahead of last year.
At the same time, there's more to choose from. 583 homes are for sale right now, the most in months. Homes are taking a little longer to sell too — about 24 days, up from 17 back in April. Buyers have more choice, so they're taking their time.
Here's what surprised me: prices didn't slip. The median sale was $620,000, the highest in seven months, and sellers are still getting about 98 cents on every dollar they ask. One caution — the median moves with whatever mix of homes happens to sell, and price per square foot is down from last year. So read prices as steady, not climbing.
That's June in one sentence: buyers have more homes to choose from, but sellers haven't dropped their prices. Homes priced for today's market are selling. Homes priced for the spring are sitting. Your asking price decides which group you're in.
Watch this month's video report.
The most important stat this month.
153 homes came off the market in June without selling — more than actually sold. That's the number I'd pay attention to. There are plenty of homes for sale. Only the well-priced ones are finding buyers.
What buyers are actually doing.
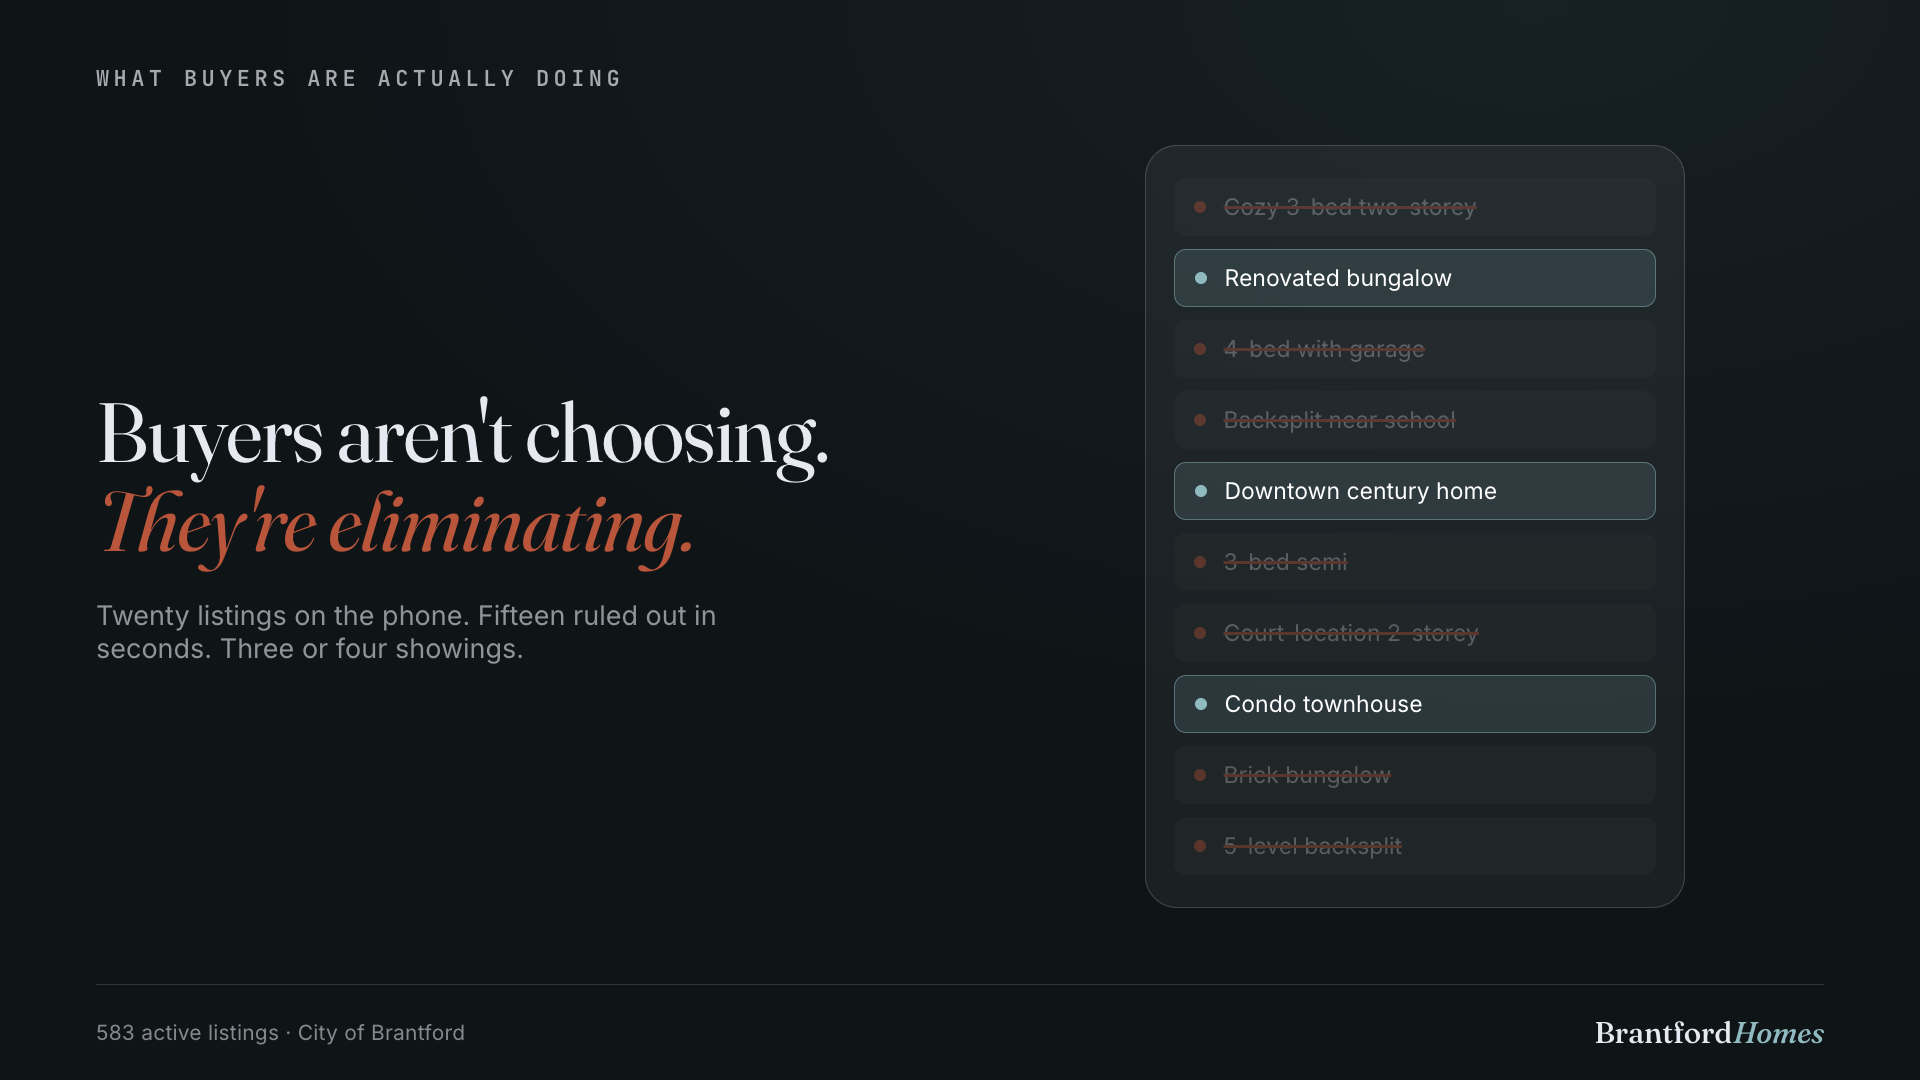
583 homes for sale changes how people shop. When there were under a hundred homes on the market, a buyer walked into your house hoping it was the one. With almost six hundred, buyers aren't choosing a house anymore — they're eliminating them.
They pull up twenty listings on their phone. They rule out fifteen in seconds, just from the photos. They book showings at three or four. Then they walk through your front door comparing your home against everything else they've seen that week. Small flaws matter more. Price matters more. Everything matters more.
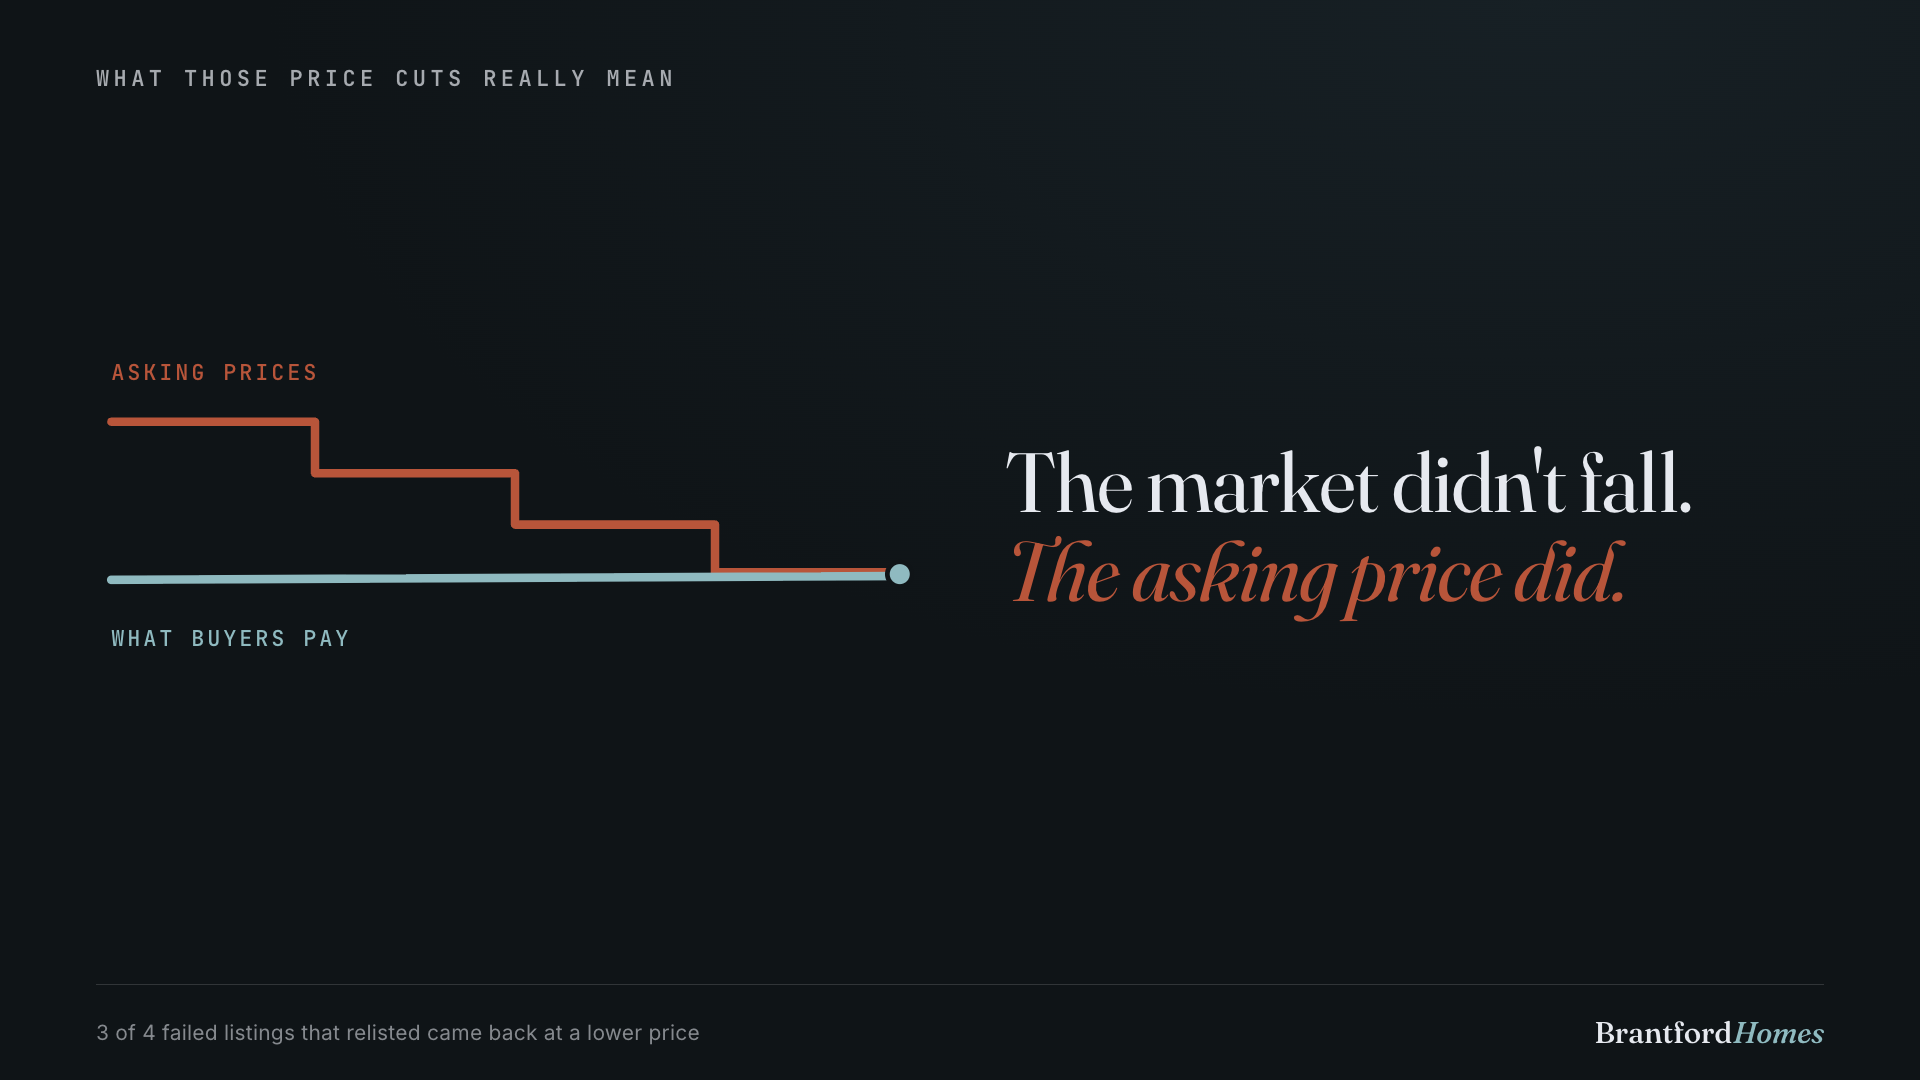
You can see it in the listings themselves. As of mid-July, more than one in four homes on the market has already cut its asking price — by about $35,000 on average. And the ones that cut have been sitting almost twice as long as the ones that didn't. That's what your home is competing against.
The market didn't fall. The asking price did.
When people hear "one in four sellers cut their price," they think the market must be crashing. It isn't. The homes that actually sold got $620,000 at the median and about 98 cents on every dollar of asking. Prices are holding.
The cuts mean something simpler: most of those homes were asking too much to begin with. Three of four failed listings that came back on the market came back at a lower price. Once a home is priced for today's market, it has a real chance of selling — some are still drawing multiple offers. Priced for last spring, it just sits.
And if you're buying, this is where the deals are right now. That last wave of overpriced spring listings is finally clearing, and some of those sellers are ready to make a deal.
What overpricing actually costs.
Every month a seller tells me some version of "we can always come down later." June put a number on what later costs. Homes that sold in their first two weeks got 99% of asking. Homes that took two months or more got 97% — and that's just the ones that sold at all.
What happened to May's failed listings.
See the actual sold prices behind these numbers
Insiders see what every home really sold for the moment it sells — and can get an email whenever a home on their street lists, changes price, or sells. Like a stock ticker for your own home. Free.
What this means for you.
Price it for June, not for last spring.
There are 583 homes for sale — the most in months — so buyers are comparing, not chasing. Three things have to work together:
- Price to what's actually selling now, not to what your neighbour got in the spring
- Show well — with this much choice, presentation is what earns showings
- Get it right in the first two weeks, when a new listing gets the most attention
153 homes came off the market last month without a sale, and almost all of them had the same problem: the price was ahead of the market. If the showings aren't coming in the first couple of weeks, that's usually the market telling you it's the number, not the house. And don't cheap out on the way in — less prep, no staging, dark phone photos. Value to a buyer is the asking price plus everything they see for it. Homes that look average get treated like they're average. The ones that stand out are still selling quickly.
You have room to breathe — but the good ones still go.
This is the most choice buyers have had in months, and homes are taking a little longer to sell, so you're not being rushed the way you would have been in the spring.
But prices haven't dropped. Sellers are still getting about 98 cents on the dollar, and well-priced homes are still selling in three to four weeks. Waiting for prices to crash isn't a plan. Being ready when the right home shows up is.
Right now the advantage goes to the buyer who's pre-approved and decisive while everyone else is still waiting to see what happens.
The monthly math.
Here's what the numbers mean for a real monthly payment. For the first time in years, a variable mortgage costs less than a fixed one — which changes the math for anyone deciding whether they can afford to make a move.
Where buyers can negotiate right now.
If you're buying, how much room you have to negotiate depends on the price range you're shopping in. In June, most of the room was at the two ends of the market — entry-level homes and homes over $800K. The family move-up range had almost none.
The most negotiating room last month was in the Under $400K and $800K–1M ranges, where buyers paid 96.1% of asking on average. The least was $650–800K at 98.7% — priced-right homes there are still going near ask. The cards below show the full picture for every range.
Your price range is its own market.
The busiest stretch was the $500–650K range, with 44 sales. Ask “how's the market?” and the honest answer is: it depends what you're buying or selling. The entry-level and the top end are behaving very differently right now — the gauge on each card shows where each one sits.
Property type matters too.
Detached houses, townhouses, and condos each have their own supply and demand. The gauge on every card shows where that type sits between a sellers' and a buyers' market right now. Anything with fewer than three sales is left out to keep it honest.
Neighbourhoods aren't moving at the same speed.
West Brant had the most sales in June, with 34 homes sold. Speed and supply vary a lot by area. A home in one part of Brantford can be facing a very different market than a similar-priced home across town — so the city-wide numbers are a starting point, not the answer for your street.
Brantford City and Brant County are different markets.
They share an MLS board, not a market. The county is bigger lots, rural properties, a smaller buyer pool, and more unique homes. Country towns can swing more month to month because there are fewer sales — the trend matters, but the absolute count matters more.
The bigger picture.
Held again — but now it could move either way. The Bank of Canada held at 2.25% on June 10 — the fifth hold in a row.
CMHC still sees Ontario as the one province where prices slip this year. CMHC's spring outlook still calls Ontario the only province where prices are expected to fall in 2026, with the market steadying later in the year and recovering in 2027.
Ontario just posted its best jobs number in nearly two years. Ontario's unemployment rate fell to 7.0% in May — the lowest since September 2024 — with 42,000 jobs added, and 84,000 over April and May together.
The trade deal is now up for review every year. On July 1 the three countries held the six-year review of the USMCA trade deal, and the US decided not to renew it as-is.
Builders are still building rentals, not houses to buy. New home starts across the country were down about 5% in May from a year ago, though the year so far is still running a bit ahead on the strength of Ontario and BC.
What I'm watching next.
First — how last month's watch items played out
Inventory kept climbing — 544 became 583, and sales slipped at the same time. More homes keep coming on the market than buyers are taking off it. That's the pattern this whole report describes.
The $650–800K range held its pace — 33 sales after May's 37, and it was the tightest range in the city — sellers there got 98.7% of asking. Move-up demand is real, not a one-month echo.
The asking-price gap didn't widen — Buyers paid about 1.7% under asking, in from 2.0% in May. Prices aren't drifting lower — sellers who price fairly are holding their ground.
May's pulled listings started facing reality — 46 of the 139 have relisted — three-quarters of them at a lower price, about $32,000 lower on average. The ones that have sold since took roughly $35,000 less than their original ask. The full breakdown is in the overpricing section above.
The jobs turn was confirmed — Ontario's unemployment fell to 7.0% in May, the best print since September 2024. If hiring holds, that's the strongest case for buyer confidence coming back this fall.
Whether inventory keeps climbing
Homes for sale rose two months straight to 583. If that keeps building through the summer, the pressure shifts further onto sellers and prices could finally start to give.
Whether prices hold
The median hit a seven-month high even as sales slowed — usually a sign of which homes happened to sell, not broad growth. I'm watching price per square foot, which is down from last year, to see if that gap widens.
The 153 failed listings
More homes came off the market than sold. The question is whether those sellers come back this summer at realistic prices or step aside until fall.
Jobs and confidence
Ontario just posted its best employment number in nearly two years. Local buyer confidence tracks job security more than interest rates, so if hiring holds, demand could firm up.
The Bank of Canada's next move
Rates held again on June 10, and the Bank is now watching inflation in both directions. Nobody should be timing a purchase around a cut that may not come.
Frequently asked questions.
Questions I get asked all the time.
These are the actual questions buyers and sellers ask me every week. Straight answers, with the latest numbers. Updated each month.
In June 2026, the median home in Brantford sold for $620,000 — half sold for more, half for less. That's about flat from a year ago; prices have leveled off after cooling from the 2022 peak. Where a specific home lands depends heavily on its type, condition, and neighbourhood.
The final takeaway.
June was the month the spring rush ended. Buyers have choice and a little time again. Sellers, so far, haven't moved on price.
The homes that are priced for today are still selling. The ones priced for last spring are becoming part of the 153 listings that didn't sell.
Whether you should buy, sell, wait, or adjust comes down to your price range, your neighbourhood, and your timeline. The city-wide numbers don't decide it — your specific situation does.
Want a read on your specific situation? Reach out.